Edge Analytics provides the ability to configure and capture specific in-location events, such as person detection, zone entry/exit, loitering, gunshot detection and more.
Note: Currently supported for Hanwha Techwin X-series and Q-series Plug & Play cameras. See the list of these Plug & Play cameras here.
Configuration:
Depending on the supported Analytics for your camera model you will see a list in the configuration settings.
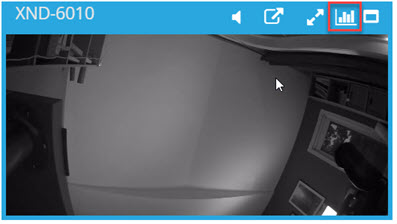
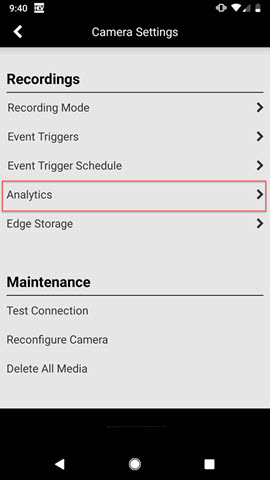
In the web interface you'll find the configuration button right in the player itself. On mobile go to the camera settings cog and select the Analytics menu.
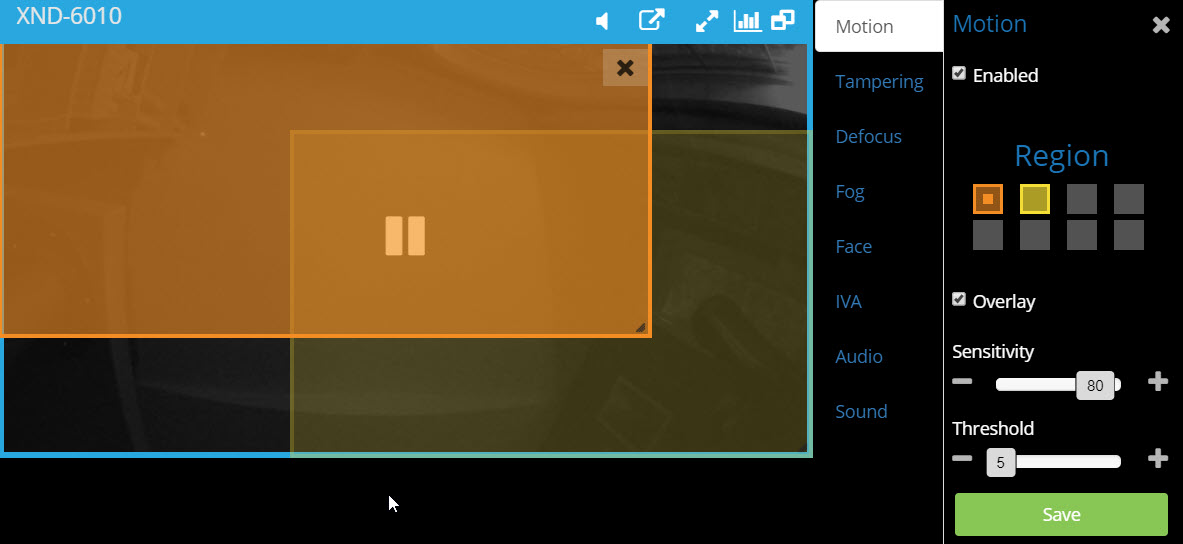
After you select Analytics, a number of options are available. This view will depend on the camera capabilities for analytics. In the web view simply select the analytic that you want to configure.
Depending on the type of analytic it may contain the following:
- Enabled checkbox - where you can enable/disable the analytic
- Region - up to 8 regions where you draw the areas required for event detection. You only need one area and the rest are optional but it gives you granularity to draw or exclude specific spots in the camera view
- Overlay - in the live view and recordings the camera will draw a box around the event that triggers
- Sensitivity - how sensitive the detection will be.
- Threshold - size of the object. Typically a small value. The bigger the number the larger the size of object in the camera view.
- Types - often with IVA where you have specialized detection such as "entering" or "exiting".
- Sound - classifications used for sound detection only such as "scream" or "glass break"
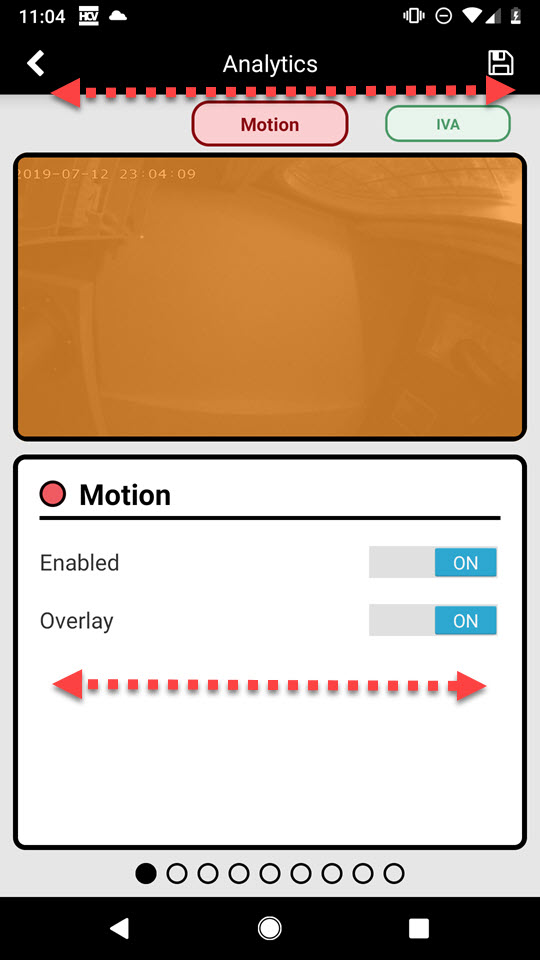
The main difference on mobile is how you navigate through menus. Scroll through all the analytics on the top menu with a swipe. Configuring multiple Regions is a swipe on the bottom. The image below shows the arrows where you can swipe to change the analytics and regions.
Viewing and filtering:
Now that you've configured all your events you can use the timeline to look at all those events and filter accordingly.
On web the events look the same with dark blue lines representing the different events. Use the filter pull down to narrow down the type of analytic. Here we see that we have 3 events for this one particular camera. Currently my filter pull down is listing all the analytics.
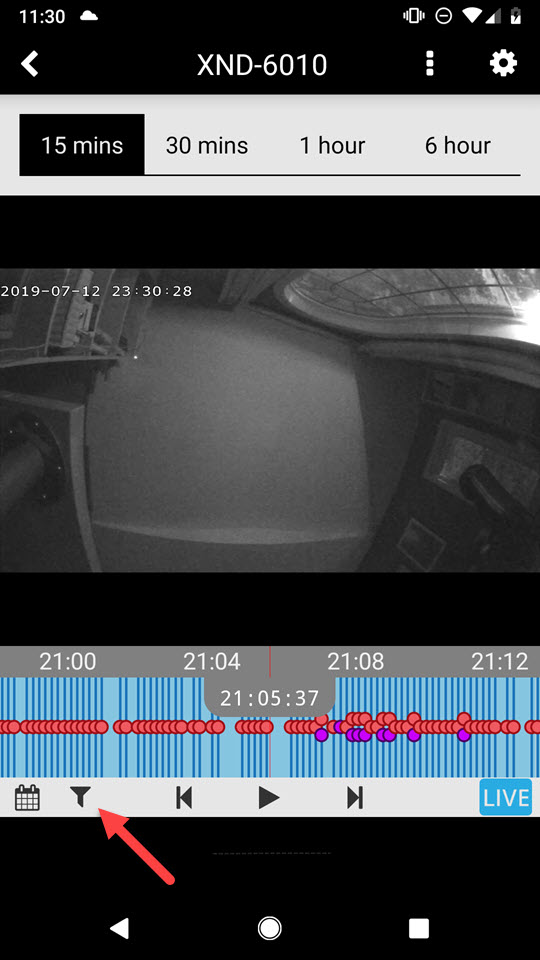
On mobile you have further granularity with color coding for each analytic.
Tip: Select 15 min scale if you have a timeline with many events.
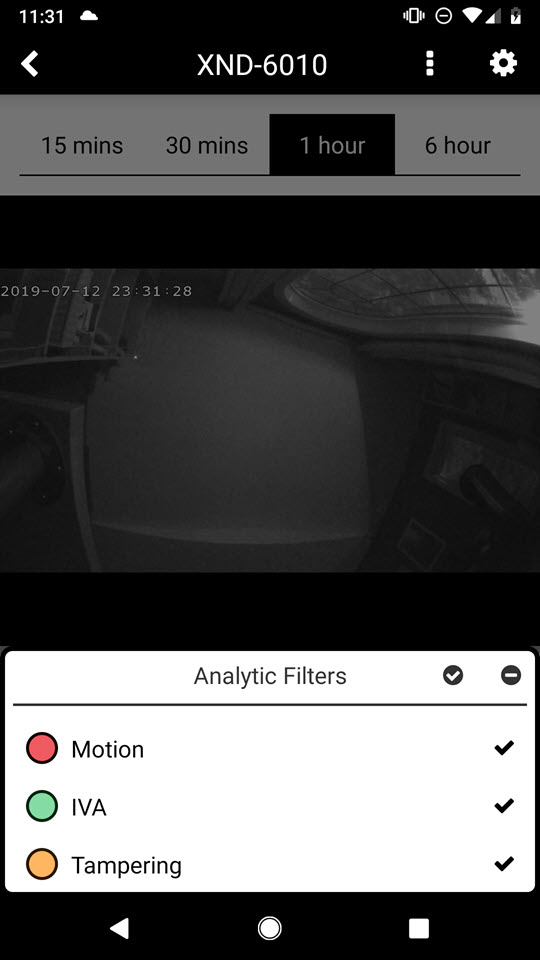
Using the filter button will show you the different analytics you can filter against with the corresponding color.
Remember that turning all analytics on at once can make a timeline quite busy. Be selective of your analytics and make sure to configure them with the proper settings.
